


May 13, 2024 - By Emily Becker - El Niño weakened substantially over the past month, and we think a transition to neutral conditions is imminent. There’s a 69% chance that La Niña will develop by July–September (and nearly 50-50 odds by June-August). Let’s kick off the ENSO Blog’s tin anniversary with our 121st ENSO outlook update!
Attention!
First things first: our beloved editor, Rebecca Lindsey, has trained us all very well, including being sure to acquaint our newer readers with the fundamentals of the El Niño/Southern Oscillation climate pattern, or ENSO. ENSO has two opposite phases, La Niña and El Niño, which change the ocean and atmospheric circulation in the tropics. Those changes start in the Pacific Ocean and affect global climate in known ways. El Niño and La Niña can be predicted many months in advance, giving us an early picture of potential upcoming temperature, rain, and snow patterns. When neither El Niño nor La Niña are present and conditions are more normal across the tropical Pacific, well, that’s ENSO-neutral conditions.
Hang 10
There was some discussion this week amongst our ENSO forecast team about whether El Niño, much weakened already early last month, is still present. El Niño is a coupled system, meaning the ocean and atmosphere both exhibit characteristic changes. The atmospheric half of El Niño is harder to detect this month; most of the standard equatorial Pacific atmospheric indicators (rain and clouds over the tropical Pacific, trade winds and upper-level winds) were pretty close to average.
However, the April average sea surface temperature in the tropical Pacific was still 0.8 °C above average according to the ERSSTv5 dataset (average = 1991–2020). The latest weekly measurement, which comes from the OISSTv2 dataset, was 0.5 °C above average. Given that the El Niño threshold is 0.5 °C, the team decided we’re right on the edge of the transition to neutral conditions. We also can’t rule out some lingering El Niño impacts in other regions of the world.
Animation of maps of sea surface temperatures in the Pacific Ocean compared to the long-term average over five-day periods from April through early May 2024. El Niño’s warm surface has weakening and a region of cooler-than-average sea surface temperature has appeared. NOAA Climate.gov, based on Coral Reef Watch maps available from NOAA View.
Once this El Niño ends, it's likely that our spell of neutral conditions won’t be a long one, with La Niña expected to develop by the late summer and last through the early winter at least.
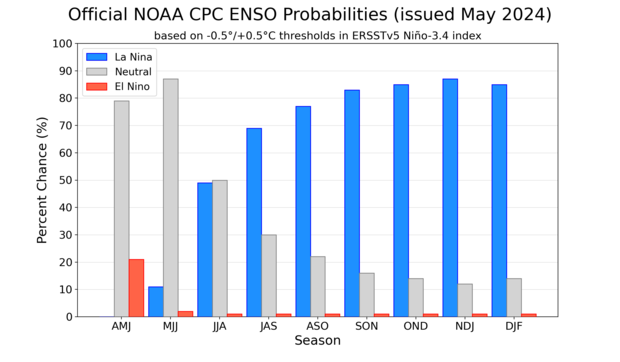
NOAA Climate Prediction Center forecast for each of the three possible ENSO categories for the next 8 overlapping 3-month seasons. Blue bars show the chances of La Niña, gray bars the chances for neutral, and red bars the chances for El Niño. Graph by Michelle L'Heureux.
We’ve seen a quick switch from El Niño to La Niña several times before in our 1950–present record, especially after a strong El Niño. This tendency is one source of confidence in the prediction that La Niña will develop later this year.
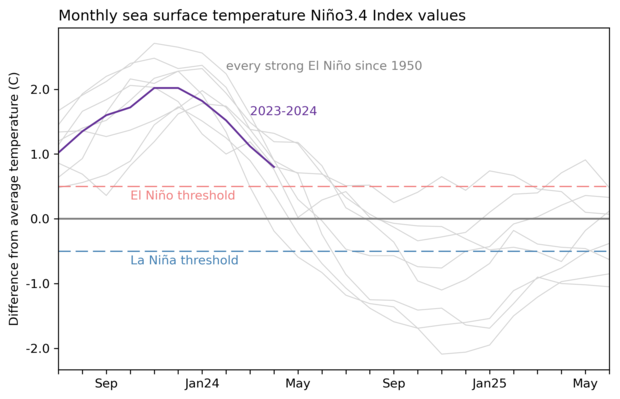
2-year history of sea surface temperatures in the Niño-3.4 region of the tropical Pacific for all strong El Niño events since 1950 (gray lines) and the current event (purple line). Graph by Emily Becker based on monthly Niño-3.4 index data from CPC using ERSSTv5.
Other factors that provide confidence that La Niña is on the way include forecasts from computer climate models and cooler-than-average water under the surface of the tropical Pacific.
10-count
Even if the sea surface temperature in the tropical Pacific lingers near the El Niño threshold for a few weeks, it’s unlikely that there will be noticeable El Niño impacts on global climate conditions this coming summer. Nat looked at how the winter turned out in the US in his recent post, but El Niño causes changes in rain and temperature patterns all around the world, with related impacts on drought, food supplies, and flooding. You can look at El Niño and La Niña’s global patterns of temperature and rain/snow throughout the seasons here.
To get some insight into how this past winter turned out in other regions, I checked in with Steven Fuhrman of NOAA Climate Prediction Center’s International Desk (footnote). Steven had this to say about the effects from El Niño since December:
Expected El Nino patterns and impacts have played out in many parts of the globe. In Africa, there has been severe drought lasting through almost the entire rainfall season. Zambia, Angola, Botswana, and Zimbabwe were likely the worst affected countries. The worst impacts from drought in terms of food insecurity are likely still to come during the lean season. This is the time of year when access to sufficient food is the hardest; it can fall at different times depending on the place and livelihood. Recently, since early April, Kenya has been horribly impacted by flooding. Several rivers are exceeding 20-year return periods, and the latest I've seen puts fatalities at 228 with a total affected population of more than 205,000 due to displacement and disease.

The rainfall difference from average for February 7–May 6, 2024 for Africa. Brown areas indicate less rain than average, while green regions received more rain. Average is based on 2001–2019. Map by climate.gov based on CPC ARC2 data.
While many El Niño-related shifts in temperature and rain/snow are strongest during the Northern Hemisphere winter (December–February), some start earlier and last longer, especially in the tropics. One example is a tendency for drier and warmer conditions in central America and northern South America from September through March or April. Rebecca wrote about the impacts on the Amazon Rainforest back in the fall. Steven added this recap:
We've also observed expected hot and dry conditions over northern South America. Above-average temperatures were remarkably persistent during the second half of 2023 in Colombia and Venezuela. The broader region saw consistent rainfall deficits. This resulted in reduced water availability for both crops and livestock in the region. Another notable impact of the reduced rainfall was low water levels in the Panama Canal, which limited the transit of vessels through it for an extended time.
El Niño’s and La Niña’s shifts in temperature and rain impact communities around the world, including affecting global health and crop yields. This is why we spend so much time studying and predicting ENSO—it can provide an early heads-up of the possibility of severe impacts and allow people time to prepare.
Double digits
Speaking of so much time—who would have thought when we launched this blog back in May 2014 that we’d still have so much to say, 10 years later? In upcoming months, we’ll keep you posted on the ENSO forecast and discuss some of the climate shifts that can be expected during La Niña, including the likelihood of an active Atlantic hurricane season and drier winter conditions through the Southwest U.S. Also, I just checked our “ENSO Blog ideas” doc, which currently runs five pages long, so… here’s to another 10??
Footnote
Fun fact: For many years, Steven and I have regularly donated blood at our local hospital, along with some of our friends. There’s a national blood shortage in the U.S. right now—please consider visiting your local blood donor center!
A blog about monitoring and forecasting El Niño, La Niña, and their impacts.
Disclaimer:
The ENSO blog is written, edited, and moderated by Michelle L’Heureux (NOAA Climate Prediction Center), Emily Becker (University of Miami/CIMAS), Nat Johnson (NOAA Geophysical Fluid Dynamics Laboratory), and Tom DiLiberto and Rebecca Lindsey (contractors to NOAA Climate Program Office), with periodic guest contributors.
Ideas and explanations found in these posts should be attributed to the ENSO blog team, and not to NOAA (the agency) itself. These are blog posts, not official agency communications; if you quote from these posts or from the comments section, you should attribute the quoted material to the blogger or commenter, not to NOAA, CPC, or Climate.gov.
Source: ENSO blog team
