


June 15, 2024 - By Rebecca Lindsey - After a year of dominance, El Niño released its hold on the tropical Pacific in May 2024, according to NOAA’s latest update. El Niño—the warm phase of the El Niño-Southern Oscillation (ENSO), our planet’s single largest natural source of year-to-year variations in seasonal climate—has been disrupting climate in the tropics and beyond since May 2023, likely contributing to many months of record-high global ocean temperatures, extreme heat stress to coral reefs, drought in the Amazon and Central America, opposing wet and dry precipitation extremes in Africa, low ice cover on the Great Lakes, and record-setting atmospheric rivers on the U.S. West Coast.
(That’s an incomplete list! I’d love to see readers use the comments to identify all the seasonal climate extremes over the past year that are consistent with the typical influence of El Niño.)
That’s a lot of climate upheaval. Is ENSO going to give us some time to idle in neutral (a state in between the warmer and cooler extremes of the El Niño-La Niña cycle) and catch our breaths? Not much, apparently. The tropical Pacific’s climate pendulum appears to be swinging back toward its other extreme: La Niña. In the Pacific, La Niña brings cooler-than-average temperatures in the central-eastern part of the basin, stronger winds both near the surface and at high altitudes, and heavier rain than normal over Indonesia and the rest of the Maritime Continent. The forecasting team thinks there’s a 65 percent chance that La Niña will arrive by July-September.
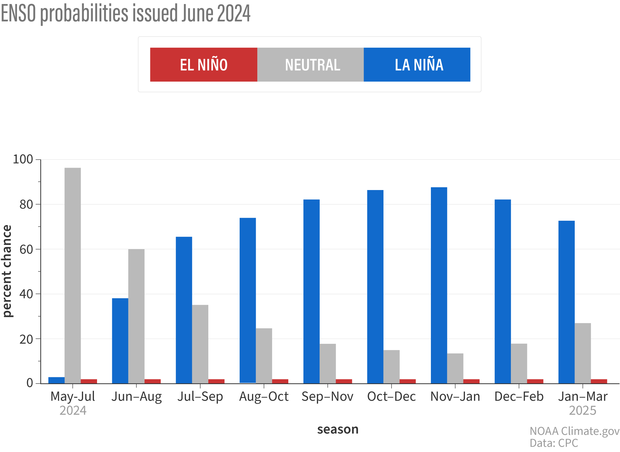
For each upcoming 3-month season, NOAA forecasts the chances of El Niño (red bars), La Niña (blue bars), or neutral conditions (gray bars) in the tropical Pacific. Neutral is overwhelmingly favored for the May-July period (labeled MJJ on the graph), but the chances for La Niña increase rapidly as soon as the June-August (JJA) period. By late summer (July-August-September, JAS), odds of La Niña are 65 percent. NOAA graph by Michelle L’Heureux.
That timing means there’s a pretty good chance La Niña will be around to influence the peak of the Atlantic hurricane season. (1) Even if the transition occurs more slowly, the odds of La Niña being in place by Northern Hemisphere winter are still 85 percent, which is similar to the NOAA forecast in previous months. Given those odds, it’s probably a good idea to refresh your memory of the typical impacts of La Niña on U.S. temperature and precipitation.
The slow pokey ocean
Emily explained in our April update that the atmospheric part of El Niño—weak-to-absent east-to-west trade winds across the tropical Pacific, dryness over Indonesia, strong convection and rainfall east of the International Dateline—had more or less shut down by early April. But surface water temperatures in the central-eastern tropical Pacific were still more than a degree Celsius (nearly 2 degrees Fahrenheit) warmer than the long-term average (long-term = 1991-2020), and some parts of the tropics still appeared to be experiencing El Niño’s typical side effects. Forecasters concluded it was too soon to issue El Niño’s curtain call.
Without the atmosphere reinforcing those warm anomalies (anomaly means “difference from average”), however, surface temperatures cooled off significantly through April and May. We’re already seeing stronger easterly (from the east) trade winds, which have cooled the overheated surface waters. You can see it happening in the animation below.
This animation shows weekly sea surface temperatures in the Pacific Ocean compared to average from March 18-June 9, 2024. Orange and red areas were warmer than average; blue areas were cooler than average. Warmer-than-average sea surface temperatures in the key ENSO-monitoring region of the tropical Pacific (outlined with black box) have started to be replaced by cooler-than-average waters—a sign that La Niña may be brewing. NOAA Climate.gov animation, based on Coral Reef Watch Data and maps from NOAA View. View the full-size version in its own browser window.
The most recent weekly and monthly observations from the key ENSO-monitoring region (dubbed “Niño 3.4”) show surface temperatures are close to average, and now cooler, deeper waters have begun surfacing. Now that both the atmosphere and the ocean have shifted away from El Niño, the event is truly over. Beneath the surface of the eastern pacific, a pool of cool water has been lurking for several months in standby mode, ready to re-supply the surface and intensify the cool anomaly required to create and maintain La Niña.
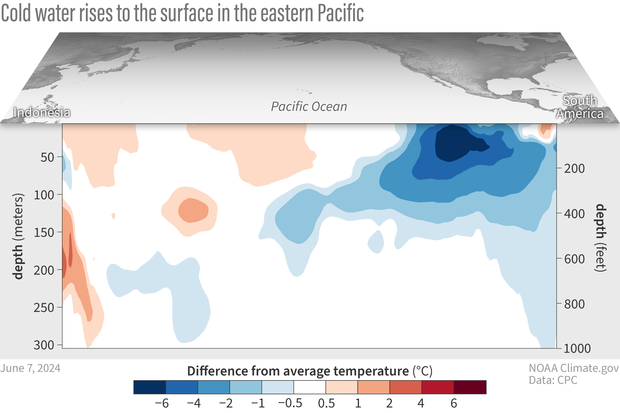
Water temperatures in the top 300 meters (1,000 feet) of the tropical Pacific Ocean compared to the 1991–2020 average in February–April 2024. NOAA Climate.gov animation, based on data from NOAA's Climate Prediction Center.
Historically, does big El Niño=big La Niña?
Of course, one of the most common questions we receive from readers is how strong do we expect the predicted La Niña to be? As far as model forecasts go, it’s too soon to put much stock in the forecasts: we’re just barely out of the notorious spring predictability barrier. The spread of possible outcomes is still pretty wide.
So, how about historical events? Does coming off a relatively strong El Niño like the recent one mean the developing La Niña will also be strong? That’s the question I posed to the team via email earlier this week. In true scientist fashion, Michelle answered me with a plot (2), which I have translated below.
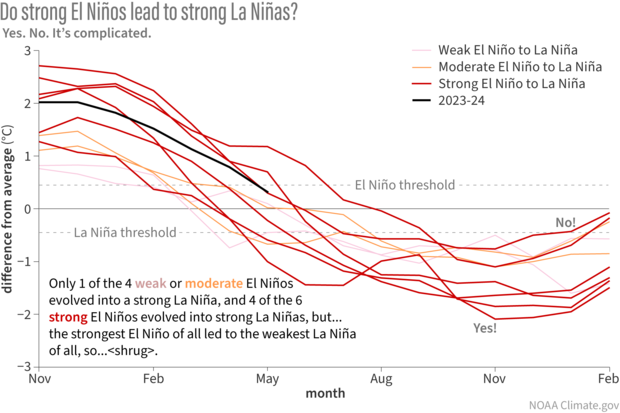
Since 1950, there have been 10 cases in which the ENSO climate pattern flipped from El Niño to La Niña with no neutral winter in between. Each line on this graph shows the evolution of sea surface temperature anomalies in the Niño-3.4 region of the tropical Pacific (the key ENSO-monitoring region) through the switch. Many, but not all, of the strongest El Niños (red lines) evolved into strong La Niñas. NOAA Climate.gov image, based on analysis by Michelle L'Heureux.
First things first, let’s acknowledge that there have only been 10 times in the historical record where ENSO flipped from El Niño into La Niña within a year. That’s not enough examples to draw any solid conclusions from. Still, it’s interesting to look at what we have and speculate as to what it might mean, so that’s all I am doing here.
Each line on the graph above represents a year in which the tropical Pacific shifted from El Niño to La Niña with no neutral winter in between. The lines are colored based on the strength of the El Niño: red for strong events (peak Niño 3.4-region sea surface temperature anomalies above 1.5 ˚C, or 2.7 ˚F), orange for moderate events (peak anomaly between 1 and 1.5 ˚C, or 1.8-2.7 ˚F), and pink for weak events (peak anomaly less than 1 ˚C, or 1.8 ˚F).
The relationship between the strength of the El Niño and the strength of the subsequent La Niña is kinda messy. It’s unlikely, but not impossible, for weak and moderate El Niños to lead to a strong La Niña (Niño 3.4 temperature anomaly of more than 1.5 ˚C below average). Only one of the pink and orange lines gets below that threshold. Meanwhile, 4 of the 6 strong El Niños do evolve into strong La Niñas. But before we put too much stock in that pattern, we should note that the strongest El Niño of all (top red line at the left hand side of the graph) wound up developing into the weakest La Niña (3). So…yeah. It’s complicated.
Strong events not required for strong impacts
The likely strength of the upcoming La Niña will become clearer the closer we get, and you’ll hear more about that in coming posts. Of course, it’s also important to remember that the strength of a given El Niño or La Niña isn’t a good predictor of the strength of the temperature or precipitation impacts in a particular place. Stronger events do make it more likely that places prone to be influenced by El Niño or La Niña will experience some level of their typical impacts, but they don’t necessarily lead to stronger impacts. In other words, even a moderate or weak La Niña can have a strong impact on a given place. So it’s important to pay attention to what we already know, which is that odds are very high (85% chance) that this winter will feature La Niña. If you’d like to know more about what a La Niña winter might mean for your part of the world, here are some great places to start.
- Global impacts of El Niño and La Niña
- U.S. impacts of El Niño and La Niña
- U.S. winter precipitation for the 20 strongest La Niña events (through 2021-22)
- U.S. winter temperature for the 20 strongest La Niña events (through 2021-22)
Footnotes
- Later this month, we’ll have a guest post about how La Niña influenced NOAA’s 2024 seasonal hurricane outlooks from lead forecaster Matt Rosencrans of NOAA’s Climate Prediction Center. In the meantime, you can read a vintage post from our early days and a more recent one with some additional detail.)
- Scientists use the word plot to refer to any data visualization, whether map or graph.
- This analysis defines strength based on how temperatures in the Niño 3.4-region compare to the long-term average in that area. By this definition, that top line is occupied by the 2015-16 El Niño. But as we have blogged about before, when it comes to ENSO impacts, what may matter more is how warm temperatures in that area are relative to the rest of the tropical oceans. Relative to the tropics-wide average, the warm anomaly associated with the 2015-16 event might not have been large enough to really count as record strong, which might explain why the La Niña that followed it was also not very strong.
A blog about monitoring and forecasting El Niño, La Niña, and their impacts.
Disclaimer:
The ENSO blog is written, edited, and moderated by Michelle L’Heureux (NOAA Climate Prediction Center), Emily Becker (University of Miami/CIMAS), Nat Johnson (NOAA Geophysical Fluid Dynamics Laboratory), and Tom DiLiberto and Rebecca Lindsey (contractors to NOAA Climate Program Office), with periodic guest contributors.
Ideas and explanations found in these posts should be attributed to the ENSO blog team, and not to NOAA (the agency) itself. These are blog posts, not official agency communications; if you quote from these posts or from the comments section, you should attribute the quoted material to the blogger or commenter, not to NOAA, CPC, or Climate.gov.
Source: ENSO blog team
