


- Existing, single-family home sales totaled 436,020 in June on a seasonally adjusted annualized rate, down 2.2 percent from May and up 28.3 percent from June 2020.
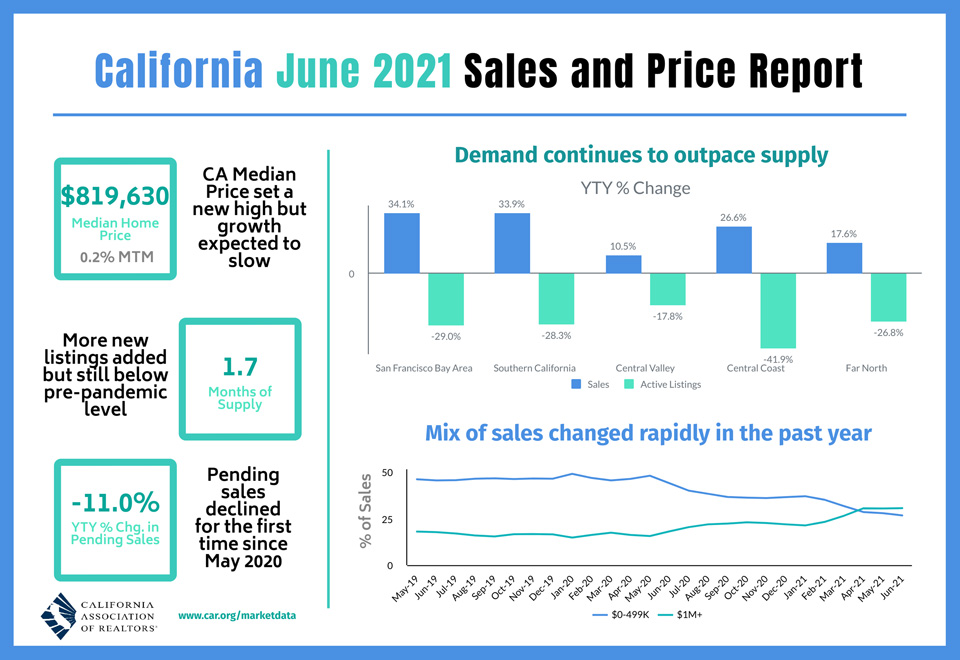
- June’s statewide median home price was $819,630, up 0.2 percent from May and up 30.9 percent from June 2020.
- Year-to-date statewide home sales were up 33.6 percent in June.
July 19, 2021 - LOS ANGELES – Despite an impressive performance in the first six months of the year, the market momentum appears to be moderating with existing home sales dipping for the second month in a row, the CALIFORNIA ASSOCIATION OF REALTORS® (C.A.R.) said last Friday.
Closed escrow sales of existing, single-family detached homes in California totaled a seasonally adjusted annualized rate of 436,020 in June, according to information collected by C.A.R. from more than 90 local REALTOR® associations and MLSs statewide. The statewide annualized sales figure represents what would be the total number of homes sold during 2021 if sales maintained the June pace throughout the year. It is adjusted to account for seasonal factors that typically influence home sales.
June home sales dipped 2.2 percent on a monthly basis from 445,660 in May but were up 28.3% percent from a year ago, when 339,910 homes were sold on an annualized basis. With strong sales growth in June, the state housing market ended the first half of the year with a year-to-date increase of 33.6 percent. Higher-priced markets continued to do well while sales of lower-priced properties remained below last year’s levels.
“We’re starting to see what a difference just a slight uptick in inventory and listings can do to help lessen the buying frenzy and create a sense of normalcy,” said C.A.R. President Dave Walsh. “The market is still extremely competitive, with 70 percent of homes selling above list price; however, the number of new listings increased in June, and both the share of listings with a reduced price and median reduction amount increased, giving buyers more opportunities to purchase.”
California’s median home price set a new record high for the fourth straight month in June as the median price slightly increased 0.2 percent on a month-to-month basis to $819,630 in June, up from May’s $818,260 and up 30.9% from the $626,170 recorded last June. The median price in California also remained above the $800,000 benchmark for the third consecutive month.
The pace of growth in home prices appeared to be decelerating, however, as the change between May and June remained below one percent, and the increase was the smallest in the past four months. On a month-to-month basis, the statewide median price increase in June 2021 was slightly below the average May-to-June growth rate of 1.0 percent observed between 1979 and 2020.
“On a year-over-year basis, the statewide median price increased more than 30 percent for the third consecutive month. Tight supply, low rates and the change in the mix of sales continue to be the primary factors pushing up home prices to record levels,” said C.A.R. Vice President and Chief Economist Jordan Levine. "However, we are expecting price growth to slow from this point on as the top end of the market begins moderating. With pending sales down for the first time in 14 months, closed sales – which have been declined 5 out of the last 6 months – will likely remain lackluster as the market enters the second half of the year.”
Other key points from C.A.R.’s June 2021 resale housing report include:
- At the regional level, four of the five major regions in the state set new record high median prices in June, with each region increasing by more than 20 percent from a year ago. The San Francisco Bay Area continue to grow at the fastest pace with a year-over-year gain of 35.0 percent, followed by Southern California (30.3 percent), the Central Valley (23.8 percent), the Far North (22.0 percent) and the Central Coast (20.8 percent).
- All 51 counties tracked by C.A.R. experienced price growth on a year-over-year basis, with 47 of them reported a double-digit rate increase in median price from last year. Del Norte had the largest price gain of 48.1 percent in June, followed by Siskiyou (40.5 percent) and Santa Barbara (39.2 percent).Twenty-five counties set new record high median prices in June. Lake had the smallest price growth of all counties with a 3.9 percent increase from June 2020. Glenn (5.1 percent), San Francisco (8.0 percent), and Lassen (8.9 percent) were the other three counties with only a single-digit price gain from a year ago.
- Higher-priced markets continued to do well while sales of lower-priced properties remained below last year’s levels. The million-dollar market increased in demand by triple-digits year-over-year, with sales of homes priced $2m and above surging 141 percent from a year ago. Sales of homes priced below $300k, on the other hand, continued to fall precipitously, with the year-over-year growth rate declining 48 percent in June. Tight housing supply continues to be the primary constraining factor for sales in the lower price segment. The state has sold more homes in the million-dollar market than the sub $500k market in Q221, a condition that has not been observed in California in the past.
- All major regions continued to grow by double-digit from a year ago as the market began to climb out of its pandemic trough reached in May 2020. Of all regions, the San Francisco Bay Area had the biggest jump of 34.1 percent year-over-year, with seven of the nine counties increasing more than 29 percent from a year ago. Southern California had a sales surge of 33.9 percent from the same month in 2020, followed by the Central Coast (26.6 percent), the Far North (17.6 percent), and the Central Valley (10.5 percent).
- Nearly nine out of 10 counties – 44 of 51 - tracked by C.A.R. had a year-over-year increase in closed sales in June, with 39 counties surging by more than 10 percent in sales from last year. Mono had the strongest growth in sales from a year ago at 100 percent, followed by San Francisco (87.1 percent), and Del Norte (80 percent). Counties with an increase from last year had an averaged gain of 30.6 percent in June, compared to 89.2 percent in May. Six counties had a sales decline from last year, with Glenn dropping the most (-57.1 percent), followed by Solano (-7.8 percent), Sutter (-6.9 percent), and Tulare (-6.9 percent).
- The state housing supply condition continued to improve with active listings reaching the highest level since last October. The number of for sale properties increased 15.4 percent in June from the prior month as more homes were being listed on the market. New active listings, while still down 12.3 percent from two years ago, increased both month-over-month and year-over-year by around 8 percent in June 2021. Housing supply typically climbs during this time of the year and remains on an upward trend until late July/early August.
- Almost all counties reported by C.A.R. declined in active listings from last June, and 47 of them dropped by double-digit when compared to the same time last year. Marin had the biggest decline in active listings, plunging 59.0 percent year-over-year, while Ventura also dropped more than half with a 51.1 percent slide from a year ago. Sutter (17.8 percent), Lassen (8.9 percent), and Stanislaus (0.5 percent) were the only counties in the state with an increase in active listings from the prior year.
- The median number of days it took to sell a California single-family home decreased to 8 days in June, down from 19 days in June 2020.
- C.A.R.’s statewide sales-price-to-list-price ratio* posted a record high in June at 104.1 percent and was 99.5 percent in June 2020.
- The statewide average price per square foot** for an existing single-family home remained elevated. At $391, June’s price per square foot was an all-time high. The price per square foot was $293 in June a year ago.
- The 30-year, fixed-mortgage interest rate averaged 2.98 percent in June, down from 3.16 percent in June 2020, according to Freddie Mac. The five-year, adjustable mortgage interest rate was an average of 2.56 percent, compared to 3.09 percent in June 2020.
Note: The County MLS median price and sales data in the tables are generated from a survey of more than 90 associations of REALTORS® throughout the state and represent statistics of existing single-family detached homes only. County sales data are not adjusted to account for seasonal factors that can influence home sales. Movements in sales prices should not be interpreted as changes in the cost of a standard home. The median price is where half sold for more and half sold for less; medians are more typical than average prices, which are skewed by a relatively small share of transactions at either the lower end or the upper end. Median prices can be influenced by changes in cost, as well as changes in the characteristics and the size of homes sold. The change in median prices should not be construed as actual price changes in specific homes.
*Sales-to-list-price ratio is an indicator that reflects the negotiation power of home buyers and home sellers under current market conditions. The ratio is calculated by dividing the final sales price of a property by its last list price and is expressed as a percentage. A sales-to-list ratio with 100 percent or above suggests that the property sold for more than the list price, and a ratio below 100 percent indicates that the price sold below the asking price.
**Price per square foot is a measure commonly used by real estate agents and brokers to determine how much a square foot of space a buyer will pay for a property. It is calculated as the sale price of the home divided by the number of finished square feet. C.A.R. currently tracks price-per-square foot statistics for 50 counties.
Leading the way…® in California real estate for more than 110 years, the CALIFORNIA ASSOCIATION OF REALTORS® (www.car.org) is one of the largest state trade organizations in the United States with more than 200,000 members dedicated to the advancement of professionalism in real estate. C.A.R. is headquartered in Los Angeles.
June 2021 County Sales and Price Activity
(Regional and condo sales data not seasonally adjusted)
|
State/Region/County |
Jun-21 |
May-21 |
Jun-20 |
Price MTM% Chg |
Price YTY% Chg |
Sales MTM% Chg |
Sales YTY% Chg |
||
|
CA SFH (SAAR) |
$819,630 |
$818,260 |
$626,170 |
0.2% |
30.9% |
-2.2% |
28.3% |
||
|
CA Condo/Townhomes |
$600,000 |
$592,000 |
$486,250 |
1.4% |
23.4% |
7.9% |
60.6% |
||
|
Los Angeles Metropolitan Area |
$737,500 |
$725,000 |
$553,000 |
1.7% |
33.4% |
10.4% |
35.1% |
||
|
Central Coast |
$890,000 |
$900,000 |
$736,500 |
-1.1% |
20.8% |
9.7% |
26.6% |
||
|
Central Valley |
$452,000 |
$445,000 |
$365,000 |
1.6% |
23.8% |
10.7% |
10.5% |
||
|
Far North |
$380,000 |
$365,000 |
$311,500 |
4.1% |
22.0% |
16.8% |
17.6% |
||
|
Inland Empire |
$525,000 |
$510,000 |
$410,000 |
2.9% |
28.0% |
10.9% |
17.0% |
||
|
S.F. Bay Area |
$1,350,000 |
$1,340,000 |
$1,000,000 |
0.7% |
35.0% |
10.9% |
34.1% |
||
|
Southern California |
$766,000 |
$752,250 |
$588,000 |
1.8% |
30.3% |
11.5% |
33.9% |
||
|
S.F. Bay Area |
Jun-21 |
May-21 |
Jun-20 |
Price MTM% Chg |
Price YTY% Chg |
Sales MTM% Chg |
Sales YTY% Chg |
||
|
Alameda |
$1,300,000 |
$1,312,500 |
$976,000 |
-1.0% |
33.2% |
6.9% |
44.8% |
||
|
Contra Costa |
$990,000 |
$1,015,000 |
$750,500 |
-2.5% |
31.9% |
10.0% |
29.2% |
||
|
Marin |
$1,712,500 |
$1,632,500 |
$1,490,000 |
4.9% |
14.9% |
16.2% |
0.0% |
||
|
Napa |
$955,500 |
$837,500 |
$725,000 |
14.1% |
31.8% |
17.2% |
52.8% |
||
|
San Francisco |
$1,950,000 |
$1,900,000 |
$1,805,000 |
2.6% |
8.0% |
24.0% |
87.1% |
||
|
San Mateo |
$2,275,000 |
$2,075,000 |
$1,735,000 |
9.6% |
31.1% |
3.8% |
34.7% |
||
|
Santa Clara |
$1,750,000 |
$1,675,000 |
$1,382,000 |
4.5% |
26.6% |
9.6% |
47.0% |
||
|
Solano |
$575,000 |
$579,000 |
$496,750 |
-0.7% |
15.8% |
21.9% |
-7.8% |
||
|
Sonoma |
$825,000 |
$780,000 |
$708,800 |
5.8% |
16.4% |
13.6% |
33.7% |
||
|
Southern California |
Jun-21 |
May-21 |
Jun-20 |
Price MTM% Chg |
Price YTY% Chg |
Sales MTM% Chg |
Sales YTY% Chg |
||
|
Los Angeles |
$796,120 |
$725,680 |
$619,320 |
r |
9.7% |
28.5% |
8.5% |
42.4% |
|
|
Orange |
$1,138,000 |
$1,100,000 |
$870,000 |
3.5% |
30.8% |
13.7% |
61.6% |
||
|
Riverside |
$575,000 |
$560,000 |
$450,000 |
2.7% |
27.8% |
7.2% |
17.0% |
||
|
San Bernardino |
$435,000 |
$410,000 |
$325,000 |
6.1% |
33.8% |
17.7% |
17.0% |
||
|
San Diego |
$865,000 |
$851,000 |
$678,000 |
1.6% |
27.6% |
16.0% |
29.2% |
||
|
Ventura |
$840,000 |
$806,000 |
$700,000 |
4.2% |
20.0% |
9.5% |
40.7% |
||
|
Central Coast |
Jun-21 |
May-21 |
Jun-20 |
Price MTM% Chg |
Price YTY% Chg |
Sales MTM% Chg |
Sales YTY% Chg |
||
|
Monterey |
$862,500 |
$887,000 |
$740,000 |
-2.8% |
16.6% |
14.9% |
48.0% |
||
|
San Luis Obispo |
$799,000 |
$775,000 |
$645,500 |
3.1% |
23.8% |
18.2% |
40.9% |
||
|
Santa Barbara |
$935,000 |
$1,299,000 |
$671,750 |
-28.0% |
39.2% |
-6.1% |
5.6% |
||
|
Santa Cruz |
$1,175,000 |
$1,300,000 |
$905,000 |
-9.6% |
29.8% |
12.9% |
14.7% |
||
|
Central Valley |
Jun-21 |
May-21 |
Jun-20 |
Price MTM% Chg |
Price YTY% Chg |
Sales MTM% Chg |
Sales YTY% Chg |
||
|
Fresno |
$375,000 |
$361,500 |
$313,950 |
3.7% |
19.4% |
13.2% |
12.4% |
||
|
Glenn |
$310,000 |
$384,000 |
$295,000 |
-19.3% |
5.1% |
-18.2% |
-57.1% |
||
|
Kern |
$325,000 |
$317,000 |
$275,000 |
2.5% |
18.2% |
9.2% |
21.6% |
||
|
Kings |
$295,000 |
$315,000 |
$265,000 |
-6.3% |
11.3% |
8.0% |
13.7% |
||
|
Madera |
$357,500 |
$360,000 |
$300,000 |
-0.7% |
19.2% |
8.9% |
3.7% |
||
|
Merced |
$360,000 |
$350,000 |
$300,000 |
2.9% |
20.0% |
17.4% |
10.9% |
||
|
Placer |
$670,500 |
$663,450 |
$515,000 |
1.1% |
30.2% |
11.7% |
12.4% |
||
|
Sacramento |
$525,000 |
$500,000 |
$417,000 |
5.0% |
25.9% |
12.1% |
13.0% |
||
|
San Benito |
$794,690 |
$810,000 |
$586,400 |
-1.9% |
35.5% |
25.4% |
45.1% |
||
|
San Joaquin |
$515,000 |
$500,000 |
$415,000 |
3.0% |
24.1% |
7.0% |
14.6% |
||
|
Stanislaus |
$430,000 |
$440,000 |
$355,000 |
-2.3% |
21.1% |
11.4% |
-4.6% |
||
|
Tulare |
$335,000 |
$324,350 |
$270,000 |
3.3% |
24.1% |
2.5% |
-6.9% |
||
|
Far North |
Jun-21 |
May-21 |
Jun-20 |
Price MTM% Chg |
Price YTY% Chg |
Sales MTM% Chg |
Sales YTY% Chg |
||
|
Butte |
$438,000 |
$449,000 |
$390,000 |
-2.4% |
12.3% |
16.1% |
2.9% |
||
|
Lassen |
$244,950 |
$247,450 |
$225,000 |
-1.0% |
8.9% |
41.7% |
36.0% |
||
|
Plumas |
$395,000 |
$423,000 |
$305,000 |
-6.6% |
29.5% |
-5.6% |
13.3% |
||
|
Shasta |
$365,000 |
$360,000 |
$295,000 |
1.4% |
23.7% |
12.6% |
17.6% |
||
|
Siskiyou |
$300,000 |
$289,000 |
$213,500 |
3.8% |
40.5% |
69.8% |
73.8% |
||
|
Tehama |
$318,500 |
$348,000 |
$240,000 |
-8.5% |
32.7% |
10.6% |
15.6% |
||
|
Other Counties in California |
Jun-21 |
May-21 |
Jun-20 |
Price MTM% Chg |
Price YTY% Chg |
Sales MTM% Chg |
Sales YTY% Chg |
||
|
Amador |
$461,000 |
$427,500 |
$337,500 |
7.8% |
36.6% |
-4.2% |
-2.8% |
||
|
Calaveras |
$488,280 |
$473,800 |
$363,000 |
3.1% |
34.5% |
26.9% |
37.5% |
||
|
Del Norte |
$358,500 |
$415,000 |
$242,000 |
-13.6% |
48.1% |
200.0% |
80.0% |
||
|
El Dorado |
$702,000 |
$688,000 |
$510,000 |
2.0% |
37.6% |
12.3% |
16.1% |
||
|
Humboldt |
$420,000 |
$400,000 |
$317,000 |
5.0% |
32.5% |
19.4% |
35.1% |
||
|
Lake |
$335,000 |
$360,000 |
$322,500 |
-6.9% |
3.9% |
24.4% |
23.0% |
||
|
Mariposa |
$409,700 |
$415,000 |
$370,400 |
-1.3% |
10.6% |
-18.2% |
12.5% |
||
|
Mendocino |
$582,500 |
$602,500 |
$425,000 |
-3.3% |
37.1% |
16.0% |
13.7% |
||
|
Mono |
$822,500 |
$1,140,000 |
$720,000 |
-27.9% |
14.2% |
20.0% |
100.0% |
||
|
Nevada |
$566,000 |
$563,250 |
$433,750 |
0.5% |
30.5% |
18.0% |
9.3% |
||
|
Sutter |
$395,000 |
$410,000 |
$341,000 |
-3.7% |
15.8% |
-17.3% |
-6.9% |
||
|
Tuolumne |
$413,820 |
$390,700 |
$305,000 |
5.9% |
35.7% |
22.1% |
47.7% |
||
|
Yolo |
$616,000 |
$617,500 |
$475,000 |
-0.2% |
29.7% |
14.5% |
4.2% |
||
|
Yuba |
$430,100 |
$400,000 |
$328,950 |
7.5% |
30.7% |
6.9% |
16.0% |
June 2021 County Unsold Inventory and Days on Market
(Regional and condo sales data not seasonally adjusted)
|
June-21 |
Unsold Inventory Index |
Median Time on Market |
|||||||
|
State/Region/County |
Jun-21 |
May-21 |
Jun-20 |
Jun-21 |
May-21 |
Jun-20 |
|||
|
CA SFH (SAAR) |
1.7 |
1.8 |
2.7 |
8.0 |
7.0 |
19.0 |
|||
|
CA Condo/Townhomes |
1.6 |
1.7 |
3.4 |
8.0 |
8.0 |
21.0 |
|||
|
Los Angeles Metropolitan Area |
1.7 |
1.9 |
3.1 |
8.0 |
8.0 |
23.0 |
|||
|
Central Coast |
1.9 |
2.0 |
3.5 |
8.0 |
9.0 |
25.0 |
|||
|
Central Valley |
1.6 |
1.6 |
2.2 |
7.0 |
6.0 |
14.0 |
|||
|
Far North |
2.3 |
2.5 |
3.5 |
11.0 |
11.0 |
30.0 |
|||
|
Inland Empire |
1.7 |
1.9 |
2.8 |
8.0 |
8.0 |
29.0 |
|||
|
S.F. Bay Area |
1.4 |
1.5 |
2.3 |
9.0 |
8.0 |
18.0 |
|||
|
Southern California |
1.7 |
1.8 |
2.9 |
7.0 |
7.0 |
20.0 |
|||
|
S.F. Bay Area |
Jun-21 |
May-21 |
Jun-20 |
Jun-21 |
May-21 |
Jun-20 |
|||
|
Alameda |
1.3 |
1.3 |
1.9 |
8.0 |
8.0 |
13.0 |
|||
|
Contra Costa |
1.2 |
1.2 |
1.9 |
7.0 |
7.0 |
14.0 |
|||
|
Marin |
1.1 |
1.5 |
2.4 |
11.0 |
11.0 |
27.0 |
|||
|
Napa |
2.2 |
2.8 |
5.7 |
33.5 |
29.0 |
52.0 |
|||
|
San Francisco |
1.4 |
1.8 |
2.9 |
12.0 |
11.0 |
19.0 |
|||
|
San Mateo |
1.4 |
1.5 |
2.4 |
7.0 |
8.0 |
10.0 |
|||
|
Santa Clara |
1.3 |
1.5 |
2.1 |
8.0 |
7.0 |
11.0 |
|||
|
Solano |
1.2 |
1.4 |
2.0 |
21.0 |
21.0 |
34.0 |
|||
|
Sonoma |
1.9 |
2.0 |
3.4 |
31.0 |
29.0 |
40.0 |
|||
|
Southern California |
Jun-21 |
May-21 |
Jun-20 |
Jun-21 |
May-21 |
Jun-20 |
|||
|
Los Angeles |
1.8 |
2.0 |
3.0 |
8.0 |
8.0 |
17.0 |
|||
|
Orange |
1.5 |
1.6 |
3.5 |
7.0 |
7.0 |
20.0 |
|||
|
Riverside |
1.7 |
1.7 |
2.7 |
8.0 |
8.0 |
27.0 |
|||
|
San Bernardino |
1.9 |
2.2 |
2.8 |
8.0 |
8.0 |
33.0 |
|||
|
San Diego |
1.5 |
1.6 |
2.2 |
6.0 |
7.0 |
12.0 |
|||
|
Ventura |
1.8 |
1.9 |
4.6 |
21.0 |
22.0 |
42.0 |
|||
|
Central Coast |
Jun-21 |
May-21 |
Jun-20 |
Jun-21 |
May-21 |
Jun-20 |
|||
|
Monterey |
2.1 |
2.4 |
4.6 |
9.0 |
9.5 |
25.0 |
|||
|
San Luis Obispo |
1.8 |
2.1 |
3.8 |
6.0 |
6.0 |
27.5 |
|||
|
Santa Barbara |
2.0 |
1.6 |
3.2 |
9.0 |
9.0 |
27.0 |
|||
|
Santa Cruz |
1.7 |
2.0 |
2.5 |
9.0 |
10.0 |
19.0 |
|||
|
Central Valley |
Jun-21 |
May-21 |
Jun-20 |
Jun-21 |
May-21 |
Jun-20 |
|||
|
Fresno |
1.7 |
1.7 |
2.1 |
6.0 |
6.0 |
15.0 |
|||
|
Glenn |
5.0 |
3.6 |
2.9 |
4.0 |
8.0 |
25.0 |
|||
|
Kern |
1.6 |
1.7 |
2.3 |
7.0 |
6.0 |
14.0 |
|||
|
Kings |
1.5 |
1.6 |
2.1 |
5.0 |
5.0 |
8.0 |
|||
|
Madera |
2.0 |
2.2 |
3.1 |
8.0 |
8.5 |
29.0 |
|||
|
Merced |
1.6 |
1.7 |
2.7 |
7.0 |
7.0 |
12.0 |
|||
|
Placer |
1.4 |
1.4 |
2.2 |
6.0 |
6.0 |
14.0 |
|||
|
Sacramento |
1.4 |
1.4 |
1.9 |
6.0 |
6.0 |
10.0 |
|||
|
San Benito |
1.8 |
2.0 |
3.4 |
8.0 |
9.0 |
51.0 |
|||
|
San Joaquin |
1.7 |
1.6 |
2.4 |
7.0 |
7.0 |
16.0 |
|||
|
Stanislaus |
1.7 |
1.7 |
1.7 |
7.0 |
6.0 |
14.0 |
|||
|
Tulare |
1.7 |
1.7 |
2.1 |
7.0 |
7.0 |
23.0 |
|||
|
Far North |
Jun-21 |
May-21 |
Jun-20 |
Jun-21 |
May-21 |
Jun-20 |
|||
|
Butte |
1.9 |
2.1 |
2.1 |
6.0 |
7.0 |
14.0 |
|||
|
Lassen |
3.9 |
5.9 |
5.8 |
72.0 |
67.0 |
106.0 |
|||
|
Plumas |
4.0 |
3.6 |
8.1 |
63.0 |
61.0 |
99.0 |
|||
|
Shasta |
2.0 |
2.2 |
3.0 |
9.0 |
8.0 |
23.0 |
|||
|
Siskiyou |
2.5 |
3.5 |
5.8 |
7.5 |
7.5 |
39.0 |
|||
|
Tehama |
2.4 |
2.6 |
4.0 |
28.5 |
32.0 |
71.0 |
|||
|
Other Counties in California |
Jun-21 |
May-21 |
Jun-20 |
Jun-21 |
May-21 |
Jun-20 |
|||
|
Amador |
2.4 |
2.2 |
4.0 |
11.0 |
8.5 |
45.0 |
|||
|
Calaveras |
2.1 |
2.4 |
4.4 |
49.0 |
48.5 |
79.0 |
|||
|
Del Norte |
3.3 |
9.9 |
9.7 |
92.5 |
67.0 |
132.0 |
|||
|
El Dorado |
1.8 |
1.7 |
3.2 |
9.0 |
7.0 |
31.0 |
|||
|
Humboldt |
2.1 |
2.3 |
3.8 |
8.5 |
7.0 |
9.5 |
|||
|
Lake |
3.0 |
3.8 |
4.6 |
12.0 |
9.0 |
48.0 |
|||
|
Mariposa |
3.8 |
3.0 |
5.6 |
7.5 |
10.0 |
66.0 |
|||
|
Mendocino |
3.4 |
3.9 |
5.8 |
36.0 |
38.5 |
55.0 |
|||
|
Mono |
3.9 |
3.7 |
11.6 |
57.5 |
61.0 |
82.0 |
|||
|
Nevada |
2.1 |
2.3 |
3.4 |
9.0 |
8.0 |
21.5 |
|||
|
Sutter |
2.4 |
1.7 |
1.7 |
8.0 |
7.0 |
21.5 |
|||
|
Tuolumne |
2.6 |
3.0 |
4.8 |
10.0 |
9.0 |
31.5 |
|||
|
Yolo |
1.2 |
1.5 |
2.1 |
7.0 |
7.0 |
19.0 |
|||
|
Yuba |
1.7 |
1.6 |
1.9 |
6.0 |
6.0 |
16.0 |
|||
Note: The MLS median price and sales data in the table below are generated from a survey of more than 90 associations of REALTORS® throughout the state, and represent statistics of existing single-family detached homes only. sales data are not adjusted to account for seasonal factors that can influence home sales. Movements in sales prices should not be interpreted as changes in the cost of a standard home. Median prices can be influenced by changes in cost, as well as changes in the characteristics and the size of homes sold. Due to the low sales volume in some areas, median price changes may exhibit unusual fluctuation.
Los Angeles Metropolitan Area is a 5- region that includes Los Angeles , Orange , Riverside , San Bernardino , and Ventura
S.F. Bay Area has been redefined to include the following counties: Alameda, Contra Costa, Marin, Napa, San Francisco, San Mateo, Santa Clara, Solano, and Sonoma
Inland Empire includes Riversideand San Bernardino
NA = not available
Source: C.A.R.