


-
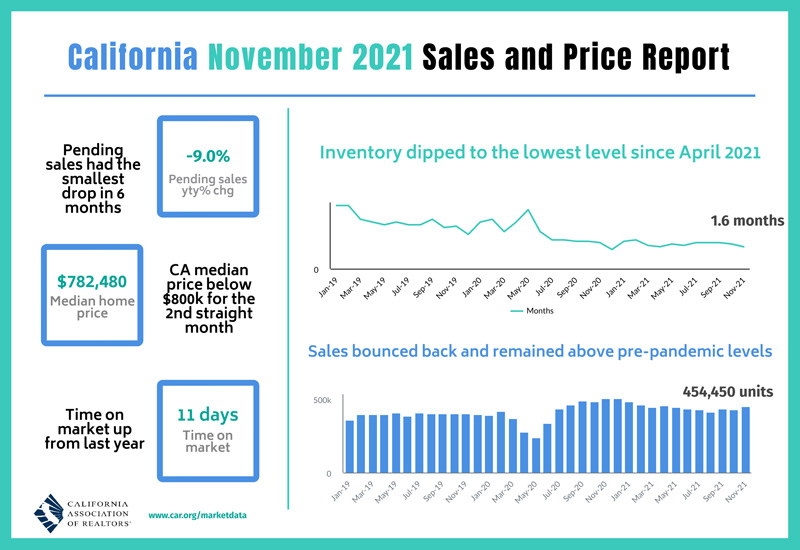
Existing, single-family home sales totaled 454,450 in November on a seasonally adjusted annualized rate, up 4.7 percent from October and down 10.7 percent from November 2020.
-
November’s statewide median home price was $782,480, down 2.0 percent from October and up 11.9 percent from November 2020.
-
Year-to-date statewide home sales were up 10.6 percent in November.
December 21, 2021 - LOS ANGELES – Despite low housing inventory and higher interest rates, California’s housing market continued to log a strong sales pace in November and remained above pre-pandemic activity, the CALIFORNIA ASSOCIATION OF REALTORS® (C.A.R.) said last week.
Closed escrow sales of existing, single-family detached homes in California totaled a seasonally adjusted annualized rate of 454,450 in November, according to information collected by C.A.R. from more than 90 local REALTOR® associations and MLSs statewide. The statewide annualized sales figure represents what would be the total number of homes sold during 2021 if sales maintained the November pace throughout the year. It is adjusted to account for seasonal factors that typically influence home sales.
November’s sales pace rose 4.7 percent on a monthly basis from 434,170 in October and was down 10.7 percent from a year ago, when 508,820 homes were sold on an annualized basis. Despite the fifth straight year-over-year sales decrease, statewide home sales maintained a 10.6 percent increase on a year-to-date basis.
“As we move further into the off-peak homebuying season, slowly rising interest rates will motivate savvy buyers to enter the market," said 2022 C.A.R. President Otto Catrina, a Bay Area real estate broker and REALTOR®. “With fewer active buyers in the market during the holidays, prospective buyers who may have taken a breather during the heated peak homebuying months can take advantage of this window of opportunity when there’s less competition and more homes to choose from.”
California home prices continued to stabilize in the off-season, dipping below the $800,000 benchmark for the second straight month. At $782,480 in November, the statewide median price was down 2.0 percent from October’s $798,440 and was up 11.9 percent from the $698,980 recorded in November 2020. The month-to-month statewide price decline of -2.0 percent was higher than the long run average of -0.1 percent recorded between an October and a November in the past 42 years but is consistent with the five-year average logged between 2016-2020.
“California’s winter housing market remains unseasonably resilient, despite market challenges of a lack of inventory, modest interest rate increases, and ongoing affordability issues,” C.A.R. Vice President and Chief Economist Jordan Levine said. “While we believe the market will continue to do well in 2022 as the economy further recovers, a widening imbalance between supply and demand will put upward pressure on prices and create headwinds for housing affordability that could slow sales in the upcoming year.”
Other key points from C.A.R.’s November 2021 resale housing report include:
- At the regional level, four of the five major regions recorded a sales decline on a year-over-year basis in November, with the Far North being the only region with an increase in demand from last month and a year ago. Wildfires in the area had a significant adverse impact on the Far North market in the late summer, but sales in the region began to bounce back in November. As the affected counties gradually recover from the disaster, strong sales growth in Shasta in the latest month was enough to pull the region’s sales ahead of last year. Central Coast was the only region with nearly a 10 percent decline in sales compared to last November.
- Nearly two-thirds of all counties — 32 of 51— tracked by C.A.R. had a year-over-year decrease in closed sales in November, with 16 counties declining by more than 10 percent from a year ago. Mono posted the biggest sales decline from last year at -38.1 percent, followed by Lassen (-36.8 percent), and Mendocino (-36.2 percent). Counties that registered a sales decline from last year had an average decrease of -14.2 percent in November.Nineteen counties experienced a year-over-year increase in home sales last month, with Del Norte (55.0 percent) surging the most, followed by Merced (28.0 percent), and King (27.1 percent)
- All major regions posted solid home price gains from a year ago, with four of them recording double-digit, year-over-year median price increases. The San Francisco Bay Area (18.2 percent) had the largest increase of all regions, followed by Southern California (14.0 percent), Central Valley (13.0 percent), and the Far North (11.8 percent). The Central Coast (9.0 percent) continued to have the smallest price growth in November and was the only region with less than a 10 percent gain from last year.
- Almost all California counties experienced year-over-year price growth, as 47 out of 51 counties tracked by C.A.R. showed a gain in their median prices from last year. Thirty-eight of them increased by double-digits from a year ago, with San Mateo leading the pack at a price surge of 34.7 percent, followed by Mariposa (33.6 percent), and Humboldt (28.4 percent). Four counties recorded a decline in their median prices from last November, with Tehama dropping the most by -12.4 percent, while Monterey (-2.4 percent), Napa (-1.6 percent), and Plumas (-1.3 percent) all dipped less than 3 percent from the prior year.
- Market competitiveness was less heated than a few months ago but remained elevated in November. While the statewide median sales-price-to-list-price ratio remained above 100 percent, the November’s number was the lowest level since March 2021. Nearly two-thirds of homes (59.2 percent) still sold above asking price in the latest monthly report, but that was the lowest level in nine months.
- California’s Unsold Inventory Index (UII) dipped on a month-to-month basis for the second straight month, as active listings fell 22.4 percent from last year. November’s UII was 1.6 months and was below 1.9 months in the same month of2020. The index indicates the number of months it would take to sell the supply of homes on the market at the current rate of sales.
- The median number of days it took to sell a California single-family home was 11 days in November, unchanged from October and was 9 days in November 2020.
- C.A.R.’s statewide sales-price-to-list-price ratio* was 101.4 percent in November 2021 and 100.5 percent in November 2020.
- The statewide average price per square foot** for an existing single-family home remained elevated. November’s price per square foot was $393, up from $332 in November a year ago.
- The 30-year, fixed-mortgage interest rate averaged 3.07 percent in November, up from 2.77 percent in November 2020, according to Freddie Mac. The five-year, adjustable mortgage interest rate averaged 2.51 percent, compared to 3.0 percent in November 2020.
Note: The County MLS median price and sales data in the tables are generated from a survey of more than 90 associations of REALTORS® throughout the state and represent statistics of existing single-family detached homes only. County sales data are not adjusted to account for seasonal factors that can influence home sales. Movements in sales prices should not be interpreted as changes in the cost of a standard home. The median price is where half sold for more and half sold for less; medians are more typical than average prices, which are skewed by a relatively small share of transactions at either the lower end or the upper end. Median prices can be influenced by changes in cost, as well as changes in the characteristics and the size of homes sold. The change in median prices should not be construed as actual price changes in specific homes.
*Sales-to-list-price ratio is an indicator that reflects the negotiation power of home buyers and home sellers under current market conditions. The ratio is calculated by dividing the final sales price of a property by its last list price and is expressed as a percentage. A sales-to-list ratio with 100 percent or above suggests that the property sold for more than the list price, and a ratio below 100 percent indicates that the price sold below the asking price.
**Price per square foot is a measure commonly used by real estate agents and brokers to determine how much a square foot of space a buyer will pay for a property. It is calculated as the sale price of the home divided by the number of finished square feet. C.A.R. currently tracks price-per-square foot statistics for 50 counties.
Leading the way…® in California real estate for more than 110 years, the CALIFORNIA ASSOCIATION OF REALTORS® (www.car.org) is one of the largest state trade organizations in the United States with more than 200,000 members dedicated to the advancement of professionalism in real estate. C.A.R. is headquartered in Los Angeles.
November 2021 County Sales and Price Activity
(Regional and condo sales data not seasonally adjusted)
|
November 2021 |
Median Sold Price of Existing Single-Family Homes |
Sales |
|||||||
|
State/Region/County |
Nov. 2021 |
Oct. 2021 |
Nov. 2020 |
Price MTM% Chg |
Price YTY% Chg |
Sales MTM% Chg |
Sales YTY% Chg |
||
|
Calif. Single-family home |
$782,480 |
$798,440 |
$698,980 |
-2.0% |
11.9% |
4.7% |
-10.7% |
||
|
Calif. Condo/Townhome |
$620,000 |
$605,000 |
$520,000 |
2.5% |
19.2% |
-4.4% |
-2.1% |
||
|
Los Angeles Metro Area |
$720,000 |
$725,000 |
$630,000 |
-0.7% |
14.3% |
-6.0% |
-3.2% |
||
|
Central Coast |
$899,000 |
$865,420 |
$825,000 |
3.9% |
9.0% |
-6.1% |
-9.6% |
||
|
Central Valley |
$452,000 |
$450,000 |
$400,000 |
0.4% |
13.0% |
-5.7% |
-4.0% |
||
|
Far North |
$380,000 |
$370,000 |
$340,000 |
2.7% |
11.8% |
4.0% |
2.3% |
||
|
Inland Empire |
$529,000 |
$525,000 |
$450,000 |
0.8% |
17.6% |
-3.0% |
-4.1% |
||
|
San Francisco Bay Area |
$1,300,000 |
$1,275,000 |
$1,100,000 |
2.0% |
18.2% |
-4.8% |
-4.8% |
||
|
Southern California |
$750,000 |
$750,000 |
$657,820 |
0.0% |
14.0% |
-6.0% |
-3.8% |
||
|
San Francisco Bay Area |
|||||||||
|
Alameda |
$1,300,000 |
$1,280,000 |
$1,049,040 |
1.6% |
23.9% |
-4.2% |
-5.2% |
||
|
Contra Costa |
$876,000 |
$900,500 |
$810,000 |
-2.7% |
8.1% |
-0.5% |
-9.0% |
||
|
Marin |
$1,535,000 |
$1,685,000 |
$1,425,000 |
-8.9% |
7.7% |
-7.5% |
-33.1% |
||
|
Napa |
$811,600 |
$850,000 |
$824,500 |
-4.5% |
-1.6% |
-4.0% |
1.0% |
||
|
San Francisco |
$1,900,000 |
$1,822,000 |
$1,697,500 |
4.3% |
11.9% |
-7.3% |
10.7% |
||
|
San Mateo |
$2,222,500 |
$2,110,000 |
$1,650,000 |
5.3% |
34.7% |
2.7% |
0.2% |
||
|
Santa Clara |
$1,692,500 |
$1,625,000 |
$1,383,000 |
4.2% |
22.4% |
-8.6% |
-4.2% |
||
|
Solano |
$593,000 |
$580,000 |
$505,250 |
2.2% |
17.4% |
-7.9% |
-7.7% |
||
|
Sonoma |
$775,000 |
$750,000 |
$715,000 |
3.3% |
8.4% |
-8.0% |
10.1% |
||
|
Southern California |
|||||||||
|
Los Angeles |
$769,500 |
$848,970 |
$673,310 |
r |
-9.4% |
14.3% |
-9.1% |
1.8% |
|
|
Orange |
$1,150,000 |
$1,120,000 |
$930,000 |
2.7% |
23.7% |
-7.7% |
-12.7% |
||
|
Riverside |
$586,900 |
$580,000 |
$490,000 |
1.2% |
19.8% |
-1.8% |
-6.8% |
||
|
San Bernardino |
$440,000 |
$445,000 |
$380,250 |
-1.1% |
15.7% |
-4.9% |
0.5% |
||
|
San Diego |
$847,750 |
$850,000 |
$740,000 |
-0.3% |
14.6% |
-6.1% |
-6.6% |
||
|
Ventura |
$858,500 |
$830,000 |
$760,000 |
3.4% |
13.0% |
3.5% |
-1.0% |
||
|
Central Coast |
|||||||||
|
Monterey |
$830,000 |
$865,250 |
$850,000 |
-4.1% |
-2.4% |
0.4% |
-6.5% |
||
|
San Luis Obispo |
$775,060 |
$800,000 |
$699,500 |
-3.1% |
10.8% |
2.2% |
-3.4% |
||
|
Santa Barbara |
$1,003,000 |
$837,000 |
$955,000 |
19.8% |
5.0% |
-24.5% |
-23.0% |
||
|
Santa Cruz |
$1,260,000 |
$1,136,000 |
$1,050,000 |
10.9% |
20.0% |
1.9% |
-3.6% |
||
|
Central Valley |
|||||||||
|
Fresno |
$385,000 |
$385,000 |
$323,500 |
0.0% |
19.0% |
-2.3% |
2.7% |
||
|
Glenn |
$360,000 |
$307,000 |
$334,750 |
17.3% |
7.5% |
23.1% |
14.3% |
||
|
Kern |
$336,940 |
$340,000 |
$290,000 |
-0.9% |
16.2% |
1.8% |
4.0% |
||
|
Kings |
$333,500 |
$325,000 |
$265,000 |
2.6% |
25.8% |
38.5% |
27.1% |
||
|
Madera |
$392,500 |
$394,880 |
$320,000 |
-0.6% |
22.7% |
-33.7% |
-19.3% |
||
|
Merced |
$375,000 |
$370,000 |
$315,500 |
1.4% |
18.9% |
-4.5% |
28.0% |
||
|
Placer |
$650,000 |
$649,000 |
$552,650 |
0.2% |
17.6% |
-3.7% |
-11.1% |
||
|
Sacramento |
$515,000 |
$510,000 |
$442,500 |
1.0% |
16.4% |
-11.6% |
-9.3% |
||
|
San Benito |
$800,000 |
$768,000 |
$665,590 |
4.2% |
20.2% |
0.0% |
-16.4% |
||
|
San Joaquin |
$495,000 |
$500,000 |
$441,500 |
-1.0% |
12.1% |
-6.4% |
-8.5% |
||
|
Stanislaus |
$435,000 |
$440,000 |
$389,000 |
-1.1% |
11.8% |
-2.6% |
1.8% |
||
|
Tulare |
$335,000 |
$325,000 |
$280,000 |
3.1% |
19.6% |
0.0% |
-2.6% |
||
|
Far North |
|||||||||
|
Butte |
$435,000 |
$460,000 |
$405,000 |
-5.4% |
7.4% |
4.7% |
1.5% |
||
|
Lassen |
$264,750 |
$232,500 |
$231,250 |
13.9% |
14.5% |
-14.3% |
-36.8% |
||
|
Plumas |
$380,000 |
$470,000 |
$385,000 |
-19.1% |
-1.3% |
18.9% |
-2.2% |
||
|
Shasta |
$375,000 |
$359,500 |
$327,250 |
4.3% |
14.6% |
-0.4% |
10.7% |
||
|
Siskiyou |
$299,000 |
$329,500 |
$263,000 |
-9.3% |
13.7% |
17.5% |
-7.8% |
||
|
Tehama |
$325,000 |
$343,000 |
$371,000 |
-5.2% |
-12.4% |
20.7% |
12.9% |
||
|
Other Calif. Counties |
|||||||||
|
Amador |
$432,500 |
$430,640 |
$360,000 |
0.4% |
20.1% |
44.0% |
4.3% |
||
|
Calaveras |
$465,320 |
$432,000 |
$407,120 |
7.7% |
14.3% |
-2.9% |
-28.6% |
||
|
Del Norte |
$384,380 |
$360,100 |
$308,750 |
6.7% |
24.5% |
10.7% |
55.0% |
||
|
El Dorado |
$665,000 |
$615,000 |
$585,000 |
8.1% |
13.7% |
21.3% |
-20.0% |
||
|
Humboldt |
$450,750 |
$420,000 |
$351,000 |
7.3% |
28.4% |
-13.6% |
-15.6% |
||
|
Lake |
$335,000 |
$345,000 |
$317,000 |
-2.9% |
5.7% |
-13.4% |
-17.4% |
||
|
Mariposa |
$499,500 |
$455,000 |
$374,000 |
9.8% |
33.6% |
25.0% |
-20.0% |
||
|
Mendocino |
$522,500 |
$534,000 |
$494,000 |
-2.2% |
5.8% |
-20.0% |
-36.2% |
||
|
Mono |
$840,000 |
$840,000 |
$806,000 |
0.0% |
4.2% |
-18.8% |
-38.1% |
||
|
Nevada |
$561,250 |
$525,000 |
$466,250 |
6.9% |
20.4% |
-4.0% |
-13.0% |
||
|
Sutter |
$425,000 |
$422,550 |
$370,000 |
0.6% |
14.9% |
-10.7% |
5.6% |
||
|
Tuolumne |
$399,000 |
$385,000 |
$337,500 |
3.6% |
18.2% |
-29.3% |
-23.1% |
||
|
Yolo |
$585,000 |
$582,500 |
$511,000 |
0.4% |
14.5% |
-13.6% |
-5.5% |
||
|
Yuba |
$415,000 |
$413,000 |
$352,500 |
0.5% |
17.7% |
-5.1% |
10.7% |
||
r = revised
November 2021 County Unsold Inventory and Days on Market
(Regional and condo sales data not seasonally adjusted)
|
November 2021 |
Unsold Inventory Index |
Median Time on Market |
||||||||
|
State/Region/County |
Nov. 2021 |
Oct. 2021 |
Nov. 2020 |
Nov. 2021 |
Oct. 2021 |
Nov. 2020 |
||||
|
Calif. Single-family home |
1.6 |
1.8 |
1.9 |
11.0 |
11.0 |
9.0 |
||||
|
Calif. Condo/Townhome |
1.4 |
1.6 |
2.2 |
11.0 |
11.0 |
14.0 |
||||
|
Los Angeles Metro Area |
1.7 |
1.9 |
2.1 |
12.0 |
11.0 |
10.0 |
||||
|
Central Coast |
1.6 |
1.8 |
2.1 |
10.0 |
10.0 |
10.0 |
||||
|
Central Valley |
1.6 |
1.8 |
1.6 |
9.0 |
9.0 |
7.0 |
||||
|
Far North |
2.7 |
3.2 |
3.0 |
17.0 |
20.0 |
14.5 |
||||
|
Inland Empire |
1.9 |
2.0 |
2.1 |
14.0 |
12.0 |
11.0 |
||||
|
San Francisco Bay Area |
1.0 |
1.4 |
1.6 |
12.0 |
12.0 |
11.0 |
||||
|
Southern California |
1.7 |
1.8 |
2.0 |
11.0 |
11.0 |
9.0 |
||||
|
San Francisco Bay Area |
||||||||||
|
Alameda |
0.9 |
1.3 |
1.3 |
11.0 |
11.0 |
8.0 |
||||
|
Contra Costa |
1.0 |
1.4 |
1.3 |
9.0 |
10.0 |
7.0 |
||||
|
Marin |
1.0 |
1.3 |
1.5 |
20.5 |
21.0 |
25.5 |
||||
|
Napa |
2.2 |
2.8 |
3.7 |
40.0 |
34.0 |
35.0 |
||||
|
San Francisco |
1.2 |
1.6 |
2.0 |
13.0 |
13.0 |
18.0 |
||||
|
San Mateo |
1.0 |
1.5 |
1.8 |
9.0 |
9.0 |
11.0 |
||||
|
Santa Clara |
0.9 |
1.1 |
1.4 |
8.0 |
8.0 |
8.0 |
||||
|
Solano |
1.2 |
1.4 |
1.7 |
28.0 |
28.0 |
27.5 |
||||
|
Sonoma |
1.4 |
1.8 |
2.7 |
38.0 |
34.0 |
33.0 |
||||
|
Southern California |
||||||||||
|
Los Angeles |
1.8 |
2.0 |
2.1 |
11.0 |
10.0 |
9.0 |
||||
|
Orange |
1.3 |
1.5 |
2.0 |
8.0 |
9.0 |
10.0 |
||||
|
Riverside |
1.8 |
2.0 |
2.1 |
14.0 |
13.0 |
11.0 |
||||
|
San Bernardino |
2.0 |
2.1 |
2.0 |
13.0 |
12.0 |
10.0 |
||||
|
San Diego |
1.3 |
1.5 |
1.6 |
9.0 |
9.0 |
7.0 |
||||
|
Ventura |
1.4 |
1.8 |
1.7 |
23.0 |
24.0 |
27.0 |
||||
|
Central Coast |
||||||||||
|
Monterey |
1.8 |
2.2 |
2.3 |
12.0 |
11.5 |
11.0 |
||||
|
San Luis Obispo |
1.4 |
1.7 |
2.2 |
8.0 |
8.0 |
10.5 |
||||
|
Santa Barbara |
1.8 |
1.4 |
2.0 |
9.0 |
10.0 |
10.0 |
||||
|
Santa Cruz |
1.3 |
1.8 |
2.0 |
10.0 |
12.0 |
8.0 |
||||
|
Central Valley |
||||||||||
|
Fresno |
1.7 |
1.9 |
1.8 |
9.0 |
7.0 |
7.0 |
||||
|
Glenn |
2.6 |
3.7 |
3.4 |
8.0 |
13.0 |
26.5 |
||||
|
Kern |
1.5 |
1.8 |
2.1 |
10.0 |
10.0 |
8.0 |
||||
|
Kings |
1.4 |
2.3 |
2.0 |
9.0 |
7.0 |
6.0 |
||||
|
Madera |
2.9 |
2.1 |
2.1 |
16.5 |
12.0 |
14.0 |
||||
|
Merced |
1.6 |
1.7 |
2.0 |
10.5 |
10.0 |
10.5 |
||||
|
Placer |
1.5 |
1.7 |
1.5 |
8.0 |
8.0 |
8.0 |
||||
|
Sacramento |
1.3 |
1.4 |
1.3 |
9.0 |
9.0 |
7.0 |
||||
|
San Benito |
1.7 |
2.1 |
1.4 |
11.0 |
8.0 |
9.0 |
||||
|
San Joaquin |
1.4 |
1.7 |
1.4 |
12.0 |
11.0 |
7.0 |
||||
|
Stanislaus |
1.5 |
1.9 |
1.6 |
9.0 |
9.0 |
7.0 |
||||
|
Tulare |
1.8 |
2.1 |
2.0 |
9.0 |
7.0 |
7.0 |
||||
|
Far North |
||||||||||
|
Butte |
1.9 |
2.4 |
2.5 |
10.0 |
10.0 |
7.0 |
||||
|
Lassen |
4.8 |
4.2 |
2.5 |
113.0 |
98.0 |
72.5 |
||||
|
Plumas |
2.6 |
4.5 |
3.8 |
80.5 |
75.0 |
118.0 |
||||
|
Shasta |
2.5 |
2.7 |
3.0 |
11.0 |
14.0 |
8.0 |
||||
|
Siskiyou |
3.9 |
5.4 |
2.9 |
29.5 |
18.5 |
11.0 |
||||
|
Tehama |
4.3 |
5.0 |
5.1 |
40.0 |
41.0 |
41.0 |
||||
|
Other Calif. Counties |
||||||||||
|
Amador |
1.8 |
3.6 |
2.7 |
15.5 |
26.5 |
17.0 |
||||
|
Calaveras |
2.5 |
2.8 |
1.8 |
58.0 |
54.0 |
62.5 |
||||
|
Del Norte |
2.5 |
3.2 |
5.3 |
98.0 |
90.0 |
116.0 |
||||
|
El Dorado |
1.7 |
2.7 |
1.6 |
18.5 |
17.0 |
18.0 |
||||
|
Humboldt |
2.4 |
2.2 |
2.2 |
12.0 |
10.0 |
12.5 |
||||
|
Lake |
4.7 |
4.5 |
3.5 |
27.0 |
26.0 |
27.0 |
||||
|
Mariposa |
3.7 |
5.1 |
3.1 |
24.0 |
26.0 |
34.0 |
||||
|
Mendocino |
5.0 |
4.3 |
3.3 |
45.5 |
41.0 |
51.0 |
||||
|
Mono |
3.4 |
3.4 |
2.5 |
83.0 |
107.0 |
105.0 |
||||
|
Nevada |
2.8 |
2.9 |
2.7 |
18.5 |
11.0 |
11.5 |
||||
|
Sutter |
1.8 |
1.8 |
1.4 |
9.0 |
10.5 |
6.0 |
||||
|
Tuolumne |
3.7 |
3.1 |
2.8 |
30.0 |
15.0 |
24.5 |
||||
|
Yolo |
1.1 |
1.2 |
1.9 |
12.0 |
9.0 |
9.0 |
||||
|
Yuba |
1.7 |
1.9 |
1.2 |
10.0 |
10.5 |
9.0 |
||||
r = revised
Source: C.A.R.